
A magazine where the digital world meets the real world.
On the web
- Home
- Browse by date
- Browse by topic
- Enter the maze
- Follow our blog
- Follow us on Twitter
- Resources for teachers
- Subscribe
In print
What is cs4fn?
- About us
- Contact us
- Partners
- Privacy and cookies
- Copyright and contributions
- Links to other fun sites
- Complete our questionnaire, give us feedback
Search:
Puzzling Victorian Doodles
by Paul Curzon, Queen Mary University of London
Buried in the archive of Ada’s personal papers in the Bodleian Library at Oxford is a piece of paper that at first sight just looks like a bunch of Doodles with odd scribbles in Ada Lovelace and Charles Babbage’s hand. They had been trying to solve a, by then, century-old puzzle that laid the foundation for a core way that computer scientists now represent data.
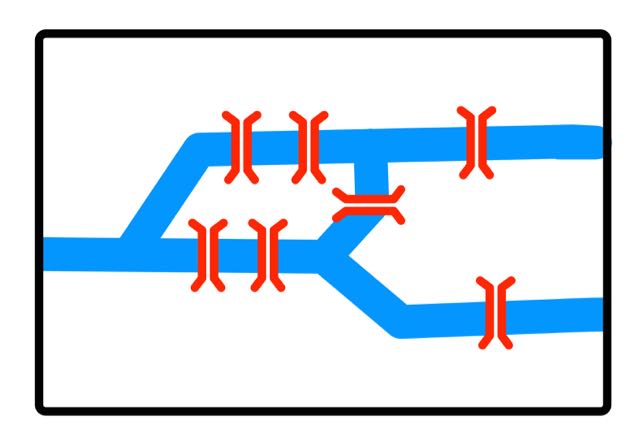
Their doodles include a simple map that any computer scientist would recognize - it shows the bridges of Konigsberg in Prussia. Other doodles show variations with a different set of bridges. The town was split in two by the river Pregel, with two large islands in the middle. The islands were connected to the two sides of the river and each other by a series of 7 bridges. Back in the 1700’s it was used as the basis of a puzzle. Could you come up with a walking tour of the whole city that would involve crossing every bridge once, but only once?
The puzzle was solved by mathematician Leonhard Euler back in 1736, but it was not so much his solution but his way of going about solving it that was revolutionary. He used what are now core parts of a computer scientist’s computational thinking toolkit.
What Euler realised was that the puzzle was easier to solve if you threw away most of the information on the map of the town. That is just the computational thinking idea of abstraction: problems are easier to solve if you hide all unnecessary information. All you need for the bridge problem is information showing the different land masses and how they are connected (i.e. the bridges between them). He made it really simple and drew small circles for each land mass (a circle for each of the two islands and the two sides of the river). He then drew lines between each pair of circles that were connected by bridges. A computer scientist calls a picture, or ‘representation’, like this a graph. The lines are called the ‘edges’ and the circles the ‘nodes’ of the graph. The problem now becomes a question of whether you can visit every node in the graph following each edge once and only once. The simplified picture given by the graph allowed Euler to see, when combined with some logical thinking, the answer to the problem.
These ideas became the foundation of what is now called graph theory. Just as they helped Euler see a simpler solution to the puzzle, graphs now help computer scientists solve all sorts of problems and are the basis of all sorts of computing, from the way satnavs find the best routes, to how computers organise data to make it easier to search. It’s not surprising that Ada and Charles found the puzzle interesting. Surprisingly, whilst there are lots of doodles that look like graphs, none match Euler’s graph of the puzzle. The drawings show routes that solve the variations of the puzzle they invented, presumably as they explored the problem. A scribbled note also suggests they did work out the solution to the actual puzzle too.
Rather than our give you the solution immediately, draw the graph and try to solve it yourself. The answer is here.