
A magazine where the digital world meets the real world.
On the web
- Home
- Browse by date
- Browse by topic
- Enter the maze
- Follow our blog
- Follow us on Twitter
- Resources for teachers
- Subscribe
In print
What is cs4fn?
- About us
- Contact us
- Partners
- Privacy and cookies
- Copyright and contributions
- Links to other fun sites
- Complete our questionnaire, give us feedback
Search:
Proof without words
Graphic news images often help sway public opinion. Images of famine in Africa led to LiveAid, a massive relief effort in 1985. Images from war zones of civilians can be disturbing enough that war leaders lose or gain political support as a result (depending on who did the bad stuff). Images can have far more power than words to argue a case … to persuade.
Mathematical proofs are just arguments intended to persuade too. They aim to leave no element of doubt that some fact is true, not for emotional reasons but by logic. Mathematicians use mathematical notation – special symbols used in precise ways – to represent things in their proofs. That's just a way of making sure the arguments are precise, with no room for doubt. Sometimes that can make them seem arcane and difficult to follow, though that's only until you've learnt the mathematical language being used.
Mathematical proofs don’t have to use words and symbols though. In fact people have been presenting proofs as pictures at least since the Ancient Greeks, and just as with news images a diagrammatic proof can be much more persuasive. Sometimes just by looking at a diagram the truth of a fact can become obvious.
For example, here is a mathematical ‘fact’ we might want to prove:
“The square of any number is equal to the sum of consecutive odd numbers.”
That may sound a bit hairy. To get even hairier (if you aren’t a mathematician), we can write this precisely in mathematical notation as:
n2 = 1 + 3 + 5 + …+ (2n – 1)
Don’t worry about the notation though. Just look at the pictures. They show what we mean by the fact and should persuade you it's true.
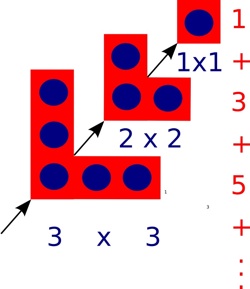
The square of a number can be drawn as a picture of dots in a square. In other words one way to work out 102, say, is to create a square of dots with sides of length 10 and then count the dots. That’s why it’s called ‘squaring’!
One way to draw the dots to make up a square is as follows. First draw one dot in the corner, then draw three dots in an L-shape round it, then draw 5 dots in an L-shape round that…and keep going. Add a new L-shape (including the first dot) 10 times, say, once for each dot along the side, and you get a square of size 10 with 100 dots altogether. Notice that at every step you still have a square, though. Also notice that each L-shape is 2 bigger than the one before. That’s because you can make it by adding one dot on the end of each arm of the last L-shape.
That means the number of dots in a square can be calculated by adding a sequence of odd numbers, one for each L-shape added: 1 + 3 + 5 + … As you add L-shapes you work up through squares of all sizes, so all squares can be made by adding odd numbers in this way.
We’ve just explained it in words, but actually it’s all in the picture, so it's possible to see without needing the words at all.
At least it may be possible for a person to see perhaps, but what about a computer? Could a computer ‘see’ a proof from a diagram? Computers are now very good at helping humans do logical proof using mathematical notation – after all they work themselves by pushing ‘symbols’ about and following rules blindly, which is all logical proof is. Seeing a proof in a diagram is different altogether though…or is it?
Mateja Jamnik, of the University of Cambridge has been tackling this problem. In fact her system, DIAMOND, can already check diagrammatic proofs created by a person to see if they really do convince. With DIAMOND you could, for example, take a series of L shape pictures like ours above and build them up step-by-step giving squares of different sizes. The system can then pull out the structure of this step-by-step proof and from that automatically obtain the equation that it proves.
DIAMOND needs a person to develop a diagrammatic proof for it to check. In the future, if Mateja has her way, the computers will be devising new diagrammatic proofs themselves that then convince we humans.